Trading Chart Patterns PDF Guide
Definition of Chart Patterns
Chart patterns are visual configurations that manifest on price charts during the process of technical analysis, a methodology employed to anticipate future price movements in financial markets. These patterns are shaped by the price action of assets, such as stocks, currencies, or commodities, over specific timeframes, which can span from minutes and hours to days, weeks, and months.
Chart patterns can be categorized into two main types: reversal patterns and continuation patterns. Reversal patterns signify a potential shift in the asset’s price trend, while continuation patterns indicate the likelihood of the existing trend persisting. These patterns emerge from the interplay of price highs, lows, and the timing of these price movements. Traders and analysts scrutinize these patterns to glean insights into market sentiment and make well-informed trading choices.
It’s crucial to understand that recognizing and interpreting chart patterns within your technical analysis does not guarantee that your trade will follow the anticipated direction suggested by these patterns. Therefore, it’s advisable to complement your analysis with additional strategies to achieve confluence and more robust confirmation before executing your trade. This approach serves to minimize potential losses and enhance your prospects for profitability.
In the following section, we will delve into some fundamental chart patterns frequently encountered as you progress in your trading journey. For offline reading, download our chart patterns pdf guide using the download button below.
10 Common Chart Patterns Used in Trading
- Head and Shoulder Pattern
- Inverse Head and Shoulder Pattern
- Bullish Flag
- Bearish Flag
- Double Top Pattern
- Double Bottom Pattern
- Ascending Triangle
- Descending Triangle
- Bullish and Bearish Pennant
- Cup and Handles
Having listed 8 chart patterns in our trading chart patterns pdf guide, the next step is to examine them individually.
Head and Shoulder Pattern:
The first chart pattern we will be examining is the head and shoulder pattern which is one of the most widely recognized reversal chart patterns in technical analysis. It looks like a head flanked by two shoulders. Typically, this chart pattern materializes at the conclusion of an upward trend and serves as an indicator of a potential shift from a bullish to a bearish trend.
The head and shoulders pattern comprises three peaks. The central peak, known as the “head,” is the highest, while the two adjacent peaks on either side are slightly lower, resembling “shoulders.” These peaks are connected via a trendline termed the “neckline,” which is drawn by joining the low points situated between the peaks.
The pattern is considered to be fully formed when the price descends below the neckline subsequent to the development of the right shoulder. This downward breach is frequently accompanied by an upsurge in trading volume, signifying confirmation of the pattern. Traders typically seek a closing price beneath the neckline to authenticate the pattern.
The head and shoulders pattern is considered a bearish reversal signal.
When the head and shoulders pattern is confirmed, it suggests that the previous uptrend is losing momentum, and a potential trend reversal to the downside may occur. Traders often interpret this pattern as a shift in market sentiment, with sellers gaining control and buyers losing strength.
The target for the bearish reversal is estimated by measuring the distance from the neckline to the top of the head and projecting it downwards from the breakdown point. This projected distance gives an approximate target for the potential decline in price.
It’s important to note that not all head and shoulders patterns lead to significant trend reversals. Traders should consider other technical indicators, such as momentum oscillators and volume analysis, to confirm the pattern’s validity and increase the probability of a successful trade.
Inverse Head and Shoulder Pattern:
The Inverse Head and Shoulder Pattern is a variation of the main head and shoulders pattern. For the inverse head and shoulder pattern, the pattern forms at the end of a downtrend and indicates a potential bullish reversal. This variation is essentially a mirror image of the classic head and shoulders pattern.
The inverse head and shoulder pattern is the direct opposite of the typical/regular head and shoulder pattern. It is found or formed in a downtrend market or chart and in most cases indicates the likely end of the bearish movement and a possible bullish reversal.
Traders often use the head and shoulders pattern as part of their technical analysis toolbox to identify potential trend reversals and make informed trading decisions. However, it’s essential to remember that no pattern or indicator guarantees future price movements, and it’s always prudent to combine chart patterns with other analysis techniques and risk management strategies when making trading decisions.
Bullish Flag:
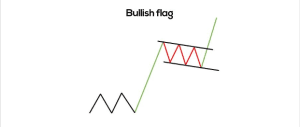
The Bullish Flag candlestick pattern is a powerful technical indicator used by traders to recognize and understand price patterns within financial markets. This pattern serves as a key element of technical analysis and can be instrumental in predicting potential bullish trends.

To grasp the significance and intricacies of the Bullish Flag pattern, let’s delve into its defining characteristics, implications, and how to effectively interpret and utilize it when it materializes on a price chart.
Key Characteristics of the Bullish Flag:
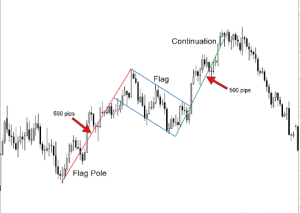
Flagpole Formation: The Bullish Flag candlestick pattern typically begins with a sharp and substantial price rise, often referred to as the “flagpole.” This initial flagpole illustrates a rapid increase in price over a relatively short time frame.
Rectangular Consolidation (Flag): Following the flagpole, there is a rectangular consolidation pattern known as the “flag.” The flag is characterized by a price range with relatively smaller fluctuations, forming a parallel trend channel that appears as a rectangle on the price chart. During this phase, the price remains relatively stable, and trading volume may decline.
Continuation Pattern: The Bullish Flag is widely recognized as a continuation pattern. It implies that after a prior strong uptrend (flagpole), the price enters a consolidation phase (flag), but it’s likely to resume the bullish trajectory once the consolidation is complete.
Interpreting the Bullish Flag:
The Bullish Flag candlestick pattern is a dynamic signal used to predict the continuation of a preceding bullish trend. Here’s how to interpret and understand this pattern:
Bullish Momentum Continuation: The Bullish Flag indicates that after a notable price increase (flagpole), there is a period of consolidation (flag) where traders take a breather, and the price stabilizes. However, this consolidation is not an indicator of a trend reversal but rather a pause before the bullish momentum is expected to resume.
Pattern Validation and Entry Points: Traders often consider a breakout above the upper boundary of the flag as an entry point for bullish positions. It’s essential to validate the pattern with factors such as increasing trading volume upon the breakout, reinforcing the likelihood of a continued upward movement.
Setting Price Targets: Traders commonly set price targets based on the length of the flagpole. They measure the height of the flagpole and extend it upward from the point of the breakout, estimating the potential price increase.
Trading Strategies with the Bullish Flag:
Utilizing the Bullish Flag candlestick pattern in trading strategies involves the following approaches:
Confirming Breakout: Traders often wait for a confirmed breakout above the upper boundary of the flag with increased trading volume before entering bullish positions.
Managing Risk: As with any trading pattern, risk management is crucial. Stop-loss orders can be placed below the lower boundary of the flag to limit potential losses in case of an unexpected reversal.
Applying Additional Indicators: Traders may complement their analysis of the Bullish Flag with other technical indicators or chart patterns for enhanced confirmation.
Bearish Flag:
The Bearish Flag candlestick pattern is a fundamental technical indicator used by traders to identify and comprehend price patterns within financial markets. This pattern plays a crucial role in technical analysis and can be instrumental in predicting potential bearish trends.
To gain a comprehensive understanding of the Bearish Flag pattern, let’s explore its defining features, implications, and effective methods for interpreting and utilizing it when it emerges on a price chart.
Key Characteristics of the Bearish Flag:
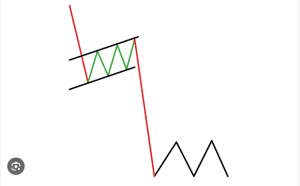
Flagpole Formation: The Bearish Flag candlestick pattern typically begins with a sharp and substantial price decline, often referred to as the “flagpole.” This initial flagpole signifies a rapid decrease in price over a relatively short period.
Rectangular Consolidation (Flag): Following the flagpole, there is a rectangular consolidation pattern known as the “flag.” The flag is characterized by a price range with relatively smaller fluctuations, forming a parallel trend channel that appears as a rectangle on the price chart. During this phase, the price remains relatively stable, and trading volume may decline.
Continuation Pattern: The Bearish Flag candlestick pattern is widely recognized as a continuation pattern. It implies that after a preceding strong downtrend (flagpole), the price enters a consolidation phase (flag), but it’s likely to continue the bearish trend once the consolidation is complete.
Interpreting the Bearish Flag:
The Bearish Flag candlestick pattern serves as a dynamic signal used to anticipate the continuation of a preceding bearish trend. Here’s how to interpret and understand this pattern:
Bearish Momentum Continuation: The Bearish Flag candlestick pattern suggests that following a significant price decline (flagpole), there is a period of consolidation (flag) where traders temporarily regroup and the price stabilizes. This consolidation is not a sign of a trend reversal but rather a brief respite before the bearish momentum is expected to recommence.
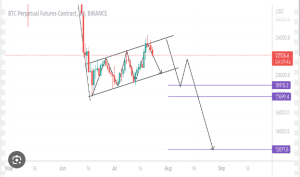
Pattern Validation and Entry Points: Traders often look for a confirmed breakout below the lower boundary of the flag as an entry point for bearish positions. This breakout should ideally be accompanied by an increase in trading volume, further reinforcing the likelihood of a continued downward movement.
Setting Price Targets: Traders frequently set price targets based on the length of the flagpole. They measure the height of the flagpole and project it downward from the point of the breakout, estimating the potential price decrease.
Trading Strategies with the Bearish Flag:
Incorporating the Bearish Flag candlestick pattern into trading strategies entails several approaches:
Confirming Breakout: Traders typically wait for a confirmed breakout below the lower boundary of the flag with increased trading volume before entering bearish positions.
Risk Management: As with any trading pattern, managing risk is vital. Stop-loss orders can be placed above the upper boundary of the flag to limit potential losses in case of an unexpected reversal.
Supplementary Indicators: Traders may supplement their analysis of the Bearish Flag with additional technical indicators or chart patterns to enhance confirmation.
To continue reading how to trade using chart patterns, you can download the trading chart patterns pdf guide using the download button below, in the chart patterns pdf guide, we explained the other 10 common chart patterns in detail and also gave a practical example of how to take trades using the chart pattern strategy.
.
How To Take Profitable Trades Using Chart Patterns:
Now that we know what these chart patterns look like, and how to identify them on our charts, we would take it a step further by examining how to use these chart patterns to take trades and integrate them into our strategy.

The first illustration we would be looking at is the inverse head and shoulder chart pattern, which is mainly a reversal pattern. Looking at the chart above, which is a daily timeframe, we can see that there is an inverse heads and shoulders pattern, identifying the left shoulder, the head, and the right shoulder, we also have the neckline indicating the rectangle.
One thing of note is that in other to know if the market is likely to reverse or not, you need to see where the reversal pattern has formed. Is it leaning against any higher timeframe structure?
 For example, from the chart above which is a weekly timeframe, we notice that the inverse heads and shoulders chart pattern found on the daily timeframe leans on the support zone on the weekly timeframe, we can also see that this support zone was tested thrice on the weekly timeframe in the forex chart above, which brings a better confluence and make the chart pattern reversal signal stronger.

Let’s now look at how we can take our trades with very low risks. Going back to the daily timeframe, we highlight the neckline of the head and shoulder pattern, after highlighting the neckline, we can go further down to a lower timeframe like the 8-hour timeframe, and look for an entry position.
To continue reading how to trade using chart patterns, you can download the trading chart patterns pdf guide using the download button below, in the chart patterns pdf guide, we explained the other 10 common chart patterns in detail and also gave a practical example of how to take trades using the chart pattern strategy.
Download Trading Chart Patterns PDF Guide
You can also read the full article here on the website by clicking on this link.
We Hope you’ve learned a lot from this. We’re glad you did. Join our telegram community to get up-to-date news, educational materials, free online classes, market analysis, and crypto futures trade signals that will help you grow and become profitable


