Technical Analysis of The Financial Markets
Technical analysis of the financial markets is the process in which traders use technical analysis, which involves the usage of chart patterns, candlestick patterns, trading indicators, support and resistance levels, market volume and historical price movement to properly analyze and speculate the price direction or the performance of the financial market.
The financial market is the collective term used to describe different types of markets such as the forex market, stock exchange market, cryptocurrency market, commodity market, bonds market and so on.
When it comes to professional trading and financial market analysis, we have several ways in which the financial market can be analyzed, three (3) ways to be precise. The three basic approaches to financial market analysis are Technical analysis, Fundamental Analysis, and Sentimental Analysis. These can also be known as the basic types of Market analysis.
Each of these analyses has its strong points and advantages. Mastering each of these types of market analysis also takes a lot of effort and dedication on the side of the traders, and this is why we have varying sets of traders. Some of them make use of only technical analysis to analyze and speculate price movement, while others focus their efforts on fundamental analysis.
While every one of the above-mentioned types of analysis is very important, you should also understand that mastering all three (3) is like an uphill task, as it takes longer time, effort, and experience. Therefore, the reason why more than 60% of the traders currently active in the financial market focus on just one method of analysis.
The most commonly used and easiest to have control over is the technical analysis. Therefore, in this article, I will be explaining all you need to know and understand about the technical analysis of the financial market. This will enable you to get a solid grasp of what technical analysis entails and the important aspects to consider when using technical analysis.
In the financial market today, understanding market dynamics and predicting price movements are crucial for success. This is where technical analysis shines. Now, let’s delve deep into the world of technical analysis of the financial markets. First, we will examine its meaning, concepts, and the various ways to navigate the market using technical analysis properly.
Meaning of Technical Analysis
Technical Analysis is a method used in financial markets to evaluate and predict future price movements of assets, such as stocks, currencies, commodities, or cryptocurrencies. It relies on the analysis of historical price data, trading volume, and various technical indicators to make informed decisions about buying, selling, or holding assets.
Technical analysts believe that past price patterns and trends tend to repeat themselves in the future. They use various tools and techniques, including chart patterns, moving averages, oscillators, and support/resistance levels, to identify potential entry and exit points for trades. The primary goal of technical analysis is to gain insights into an asset’s price direction and the strength of that trend.
In essence, technical analysis involves interpreting market data in graphical or numerical form to make predictions about future price movements. It is a crucial tool in the arsenal of traders and investors in financial markets.
Basic Concepts for Technical Analysis of the Financial Markets
Price and Volume Data
At its core, technical analysis relies on historical price and volume data. Analysts use this data to identify trends, patterns, and potential reversals in asset prices. Historical Price here means the previous price action/movement of a financial instrument. Traders use the charts they have to examine the previous price movement of the commodity they are looking to trade and use the feedback they get as part of the needed data for speculating future prices.
Volume data, on the other hand, in the financial market refers to the quantity or number of shares, contracts, or units of a particular asset that are bought or sold during a specific period, typically within a trading day. It is a critical component of market data and provides valuable information about the level of activity and interest in a particular security or market. This data is very effective in technical analysis as the trader is able to determine the current market sentiment, making it easier to predict price movement.
Chart Types
Another very important concept we will examine is the chart. Charts are like the medium traders use in communicating with the market, and this speaks volumes about their importance. Technical analysts use various types of charts, including candlestick, bar, and line charts, to visualize price data. Each chart type has its own advantages and is chosen based on the analyst’s preference and objectives. Let us briefly look at the types of charts available for technical analysis in the financial market.
The three primary types of forex charts are:
Line Charts:
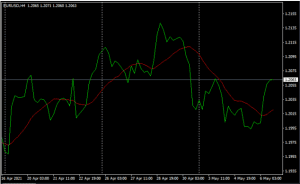
Line charts are the simplest form of forex charts. They connect closing prices of currency pairs over a specific time period with a single line. Line charts provide a basic overview of price trends but lack the detail of other chart types. They are useful for identifying long-term trends and general market direction.
Bar Charts:
Bar charts display price information in a more detailed format. Each bar on the chart represents a specific time interval, such as one hour or one day. The bars show the opening price, closing price, and the high and low prices during that time period. Bar charts also often include volume data. Traders use bar charts to analyze price patterns, trends, and potential reversals.
Candlestick Charts:
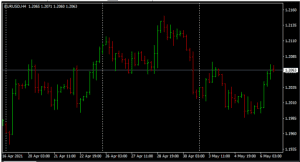
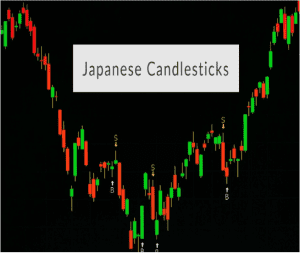
Candlestick charts are similar to bar charts but provide a more visual representation of price movements. Each candlestick consists of a rectangular “body” that represents the price range between the opening and closing prices. Additionally, “wicks” or “shadows” extend above and below the body, indicating the high and low prices during the time interval. Candlestick patterns are widely used for technical analysis as they offer insights into market sentiment and potential trend reversals.
You can look up my article on candlestick patterns to get a deeper knowledge and understanding of candlestick patterns and how they can be used for effective technical analysis.
Support and Resistance Levels
Support and resistance levels are technical analysis tools used by traders in financial markets. They are simple yet effective methods that enable traders to determine the direction of the market quickly, the best timing for market entry, and the ideal points for exiting a trade at either a profit or loss. By identifying support and resistance levels on a chart, traders can easily answer these questions and develop a sound trading idea.
Definition of Support and Resistance
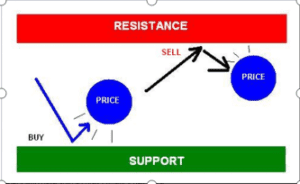
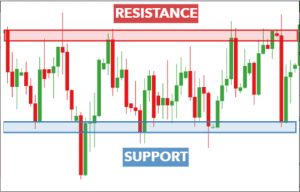
Support levels represent price points where an asset tends to find buying interest, preventing it from falling further. Resistance levels are price points where selling interest often caps further price increases. These levels are crucial for identifying potential entry and exit points. Now, let’s get a little deeper into this.
Support:
A price level where demand is strong enough to prevent further price decline and pushes for an inclination or increase from that particular level. Support is a term used in finance to refer to the price level at which demand, or buying power, is strong enough to prevent the price of an asset from declining further.
The idea is that as the price approaches the support level, buyers see a better deal and are more likely to buy, while sellers become less likely to sell because they are getting a worse deal. This shift in supply and demand dynamics can result in demand overcoming supply, which can help to prevent the price from falling below the support level.
Resistance:
A price level where selling pressure is sufficient to halt upward price movement. Resistance is a key concept in technical analysis that refers to a price level where selling pressure is strong enough to prevent an asset’s price from rising further.
The idea behind this is that as the price approaches resistance, sellers may be more inclined to sell while buyers become less interested in buying, resulting in a stalemate in the market. This lack of buying pressure against the selling pressure means that the market may experience a reversal, and the price is unlikely to breach the resistance level.
Trendlines and Patterns
While support and resistance levels are basic technical analysis concepts, trendlines and chart patterns can be said to be the trader’s guide as they help the trader understand at a glance the general direction of the market. Trendlines are drawn to connect successive highs or lows in a price chart. They help identify the direction of the trend. Chart patterns, such as triangles and rectangles, provide visual cues about potential future price movements.
These above concepts are very important if you want to make use of technical analysis in the financial market properly. Let me explain them individually for better understanding.
Trendlines
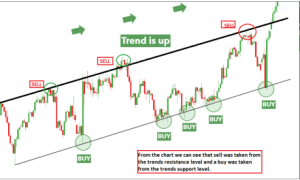
The trendline strategy utilizes the trendline as either support or resistance. A trend that goes on for a while tends to form a channel. In an uptrend, you have the higher highs (H.H) and the higher lows (H.L), while in a downtrend, you have the lower highs (L.H) and lower lows (L.L).
Identifying Trends
Uptrend: Higher highs and higher lows characterize an uptrend.
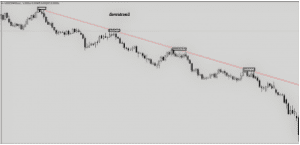
Downtrend: Lower highs and lower lows indicate a downtrend.
Sideways/Range: When prices move within a range, it’s a sideways or ranging market.
Trendlines and Their Significance
Trendlines help visualize trends. Drawing them connects the lows or highs in an uptrend or downtrend, respectively. As shown in the diagram above, drawing your trendlines also helps you in identifying the diagonal support and resistance levels. They can also be called pullback and continuation levels.
To get a more in-depth understanding of trendlines analysis, you can click the link below to read the article.
Read Also: The Secret to Profitable Forex Trading: Trendlines and Channels
Charts Patterns
Price patterns are specific formations that often repeat in the market and serve as an indication of an active price action. Many of the most effective price patterns occur when a trend is about to reverse or when there might be a possible dip or rise in price action. Some of the price patterns work both ways, doubling their usefulness.
There are basically three types of chart patterns, and they are:
Continuation Patterns
Continuation patterns, such as flags and pennants, suggest that the prevailing trend is likely to continue after a brief consolidation. Traders look for these patterns to anticipate future price movements.
Consolidation Patterns
Consolidation patterns, like triangles and rectangles, represent periods of indecision in the market. Traders watch for breakouts from these patterns, which can signal the resumption of a trend.
These explanations provide a comprehensive understanding of the fundamental concepts and tools used in technical analysis, setting the stage for effective application in financial markets.
Reversal Patterns
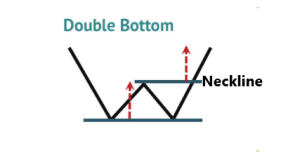
Reversal patterns, such as head and shoulders and double top/bottom patterns, indicate a potential change in the current trend. Recognizing these patterns can be crucial for timely trading decisions.
Examples of Reversal Chart Patterns
Head and Shoulders:
A reversal pattern with three peaks – the middle one is the highest. The head and shoulder pattern makes a shape that looks similar to a head and two shoulders. It is made up of a head pattern, which is either the highest in the case of a bearish reversal or the lowest in the case of a bullish reversal.
Double Tops/Bottoms:
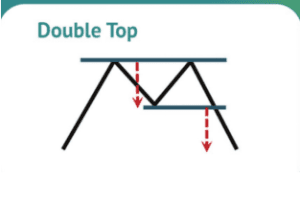
Reversal patterns indicating potential trend change. Double-top price patterns occur when a currency pair reaches the highest point, followed by a second attempt upwards. This, in turn, forms an “M” shape where a neckline emerges.
Double bottom price patterns occur when a currency pair reaches the lowest point, followed by a second attempt downwards. This, in turn, forms a “W” shape where a neckline emerges.
There are lots more price/chart patterns, some of which include ascending triangles and descending triangles, bullish and bearish pennants and so on. To better understand price patterns, their shapes, and what they represent in the market, you can read our article on price/chart patterns.
Read Also: 8 Chart Patterns Every Beginner Trader Must Know to Succeed in Trading
Tools and Indicators
Tools and indicators are like the Virtual assistants of every trader who uses technical analysis to understand the market. They make analysis easier and less stressful for the traders and also make the analysis more accurate and effective. This is because when using indicators like the average true range, the stochastics and the RSI, the trader is able to compute a more robust amount of historical market data over a lengthy period of time. This, in turn, increases and improves the efficiency of the trader.
Here are examples of some of the most basic indicators and tools used in the technical analysis of the financial market.
Moving Averages
Moving averages, such as the simple moving average (SMA) and exponential moving average (EMA), help smooth out price data to reveal trends. They are used to identify trend directions and potential crossovers. This indicator is arguably the most widely used indicator among technical analysts. To learn more about moving averages, you can also read my article on it here.
Relative Strength Index (RSI)
The RSI is a momentum oscillator that measures the speed and change of price movements. It ranges from 0 to 100 and is used to identify overbought and oversold conditions in an asset’s price.
MACD (Moving Average Convergence Divergence)
The MACD is a trend-following momentum indicator that illustrates the relationship between two moving averages. Traders use it to identify potential trend reversals and gauge the strength of a trend.
Bollinger Bands
Bollinger Bands consist of a middle band (SMA) and two outer bands that are standard deviations away from the middle band. They help traders assess price volatility and potential entry and exit points.
Fibonacci Retracement
Fibonacci retracement levels are horizontal lines drawn on a chart to identify potential support and resistance levels based on key Fibonacci ratios. They are used to forecast potential price reversals.
Stochastic Oscillator
The stochastic oscillator is a momentum indicator that compares the closing price of an asset to its price range over a specific period. It helps traders identify potential turning points in price trends.
There are a lot more indicators in the financial market, and many are still being created. To get a deeper understanding of how these trading indicators work and how they can be used in technical analysis, you can read my article on trading indicators by following the link below.
See Also: The Best Trading Indicators for Beginner Traders in 2023
Technical Analysis Strategies
Dow Theory
My article on Technical analysis of the financial market will not be complete without mentioning some of the pacesetters in the financial stratosphere, one of which is Charles Dow, who invented the Dow theory. The Dow Theory is considered the foundational framework upon which modern technical analysis of the financial markets is built. The relationship between Dow Theory and technical analysis is fundamental, as Dow Theory laid the groundwork for many key concepts and principles that are still integral to technical analysis today. Now let’s look at how the Dow theory works and how it relates to modern-day financial market analysis.
- Historical Foundation: Dow Theory was developed by Charles Dow, the co-founder of Dow Jones & Company, in the late 19th century. It was published in a series of articles in the Wall Street Journal. Dow’s work marked one of the earliest attempts to systematically analyze and understand stock market behaviour. This historical context is important because it predates the formalization of technical analysis.
- Market Trends: Dow Theory introduced the concept of market trends, distinguishing between primary, secondary, and minor trends. This concept forms the cornerstone of technical analysis. Technical analysts use trend analysis to identify the overall direction of a market or asset’s price movement, whether it’s in an uptrend, downtrend, or consolidation.
- Support and Resistance: Dow Theory emphasized the significance of support and resistance levels. Support represents a price level where a declining market tends to find buying interest and halt its decline. Resistance is a price level where a rising market encounters selling pressure. These levels are key components of technical analysis and are used to identify potential entry and exit points.
- Volume Confirmation: Charles Dow also noted the importance of volume in confirming trends. He believed that increasing or decreasing trading volume could validate or invalidate a trend. This concept is still widely used in technical analysis. Analysts often look for rising volume during an uptrend (confirming bullishness) and declining volume during a downtrend (confirming bearishness).
Dow Theory’s Relevance:
While Dow Theory was developed over a century ago, its principles remain highly relevant in modern technical analysis. The idea of identifying trends, analyzing volume, and using support and resistance levels is still integral to the practice. Many of the patterns, chart formations, and indicators used in technical analysis today are built upon these foundational Dow Theory concepts.
Elliott Wave Theory
Elliott Wave Theory is a specific approach within the broader field of technical analysis of the financial markets. It offers a unique perspective on market behaviour and price patterns.
Overview of Elliott Wave Theory
Ralph Nelson Elliott introduced the Theory or trading strategy, he stated that financial markets move in repeating patterns or waves. This theory divides price movements into impulsive waves (with the trend) and corrective waves (against the trend). Understanding Elliott Waves aids analysts in predicting market cycles and potential turning points.
SMC Trading Strategy
Smart Money Concepts traces its roots back to The Inner Circle Trader (ICT), a program provided by trader Michael J. Huddleston, who can be said to be the supposed creator of the strategy. A lot of modern traders have been coming to terms with this trading principle, as it encompasses technical analysis, taking into consideration all the basic concepts used in technical analysis, making them easier and more understandable.
Overview of SMC Trading Strategy
SMC is, at its core, a more conventional trading method than you might expect. Rather than relying on complicated algorithms or advanced technical analysis, SMC’s trading strategy is founded upon a simple philosophy about how markets operate.
SMC asserts that market makers, entities such as banks, and hedge funds are manipulative by nature and that they actively work against retail traders, which seems to be true from my years of trading experience. As an SMC trader, you should, therefore, base your trading strategy on the actions of the “smart money”, that is, the money the market makers bring in and take from the market.
Essentially, the idea is to mirror the trades of market makers. By analyzing supply and demand zones and market structure, you can gain insight into how these entities are trading and make informed decisions about your own trades.
In summary, while SMC may sound foreign due to its unique terminology, it is, in fact, a very simple and easy-to-understand strategy.
If you want to learn more about the SMC Trading Strategy, you can read my article on that by clicking the link below.
Read Also: How to Trade Like a Pro Using SMC Trading Strategy
Important Key Notes
Timing Entry and Exit Points
Technical analysis excels in timing entry and exit points. By overlaying technical analysis with fundamental data, traders can make well-informed decisions about when to buy or sell assets. It makes it easier for sniper entries and also helps the trader to get a good risk-to-reward ratio when entering the financial market.
Addressing Criticism
Technical analysis faces criticism from individuals who argue that it lacks a solid theoretical foundation or relies too heavily on historical data. Addressing these criticisms helps traders use technical analysis more effectively while acknowledging its strengths and weaknesses. It is a no-brainer that some of these criticisms are true, and as a trader, using fundamental analysis to back your historical market data will be a lot more helpful.
Risk Management
Effective risk management is integral to successful trading. Traders must determine the appropriate position size, set stop-loss orders, and diversify their portfolios to protect capital. No trader can become profitable when not employing risk management strategies. Therefore, it is very important to understand proper money management and psychological management skills.
Benefits of Technical Analysis
Setting Stop-Loss and Take-Profit Levels
Technical analysis assists in setting stop-loss and take-profit levels based on price patterns and support/resistance levels. This disciplined approach ensures that traders exit positions in a controlled manner.
Using Technical Analysis Across Different Financial Markets
One amazing benefit of technical analysis is that its utility or usefulness cuts across different financial markets as shown below.
Forex
Technical analysis can be applied to the foreign exchange market (Forex) to analyze currency pairs. Traders use technical tools and patterns to forecast currency price movements.
Stocks
When trading individual stocks, technical analysis helps identify potential buy and sell signals. By analyzing stock price charts and indicators, traders make informed decisions.
Cryptocurrencies
Given their high volatility, cryptocurrencies are popular assets for technical analysis. Traders use technical tools to navigate the price fluctuations of digital currencies like Bitcoin and Ethereum.
Commodities
Technical analysis is valuable in commodities trading, helping traders analyze the price trends of assets like gold, oil, and agricultural products.
The Role of Technology
Impact of Technology
Technology has revolutionized technical analysis. Trading platforms, charting software, and algorithmic trading have made technical analysis more accessible, easy and efficient. However, this cannot take the place of human cognitive analysis, and study and technology have made it easier to carry out some deep historical market data research.
Automation and Algorithmic Trading
Algorithmic trading uses technical analysis algorithms to execute trades automatically. This approach has gained prominence due to its ability to execute trades swiftly based on predefined technical criteria. It also has its downside as market price action and movement varies from time to time and from season to season. The fundamental event also alters the direction of the market and, in most cases, renders technical analysis dormant for a while.
Using algorithmic trading at times like this might cause serious losses since the bot is programmed to run using a specific market flow.
Final Words
Technical analysis is a potent tool for traders and investors seeking to navigate the intricate world of financial markets. Properly Understanding the foundational concepts and practical tools mentioned in the article makes you better equipped to make informed trading decisions. As you embark on your journey in technical analysis, remember that success in trading demands practice, discipline, and continuous learning.
Additional Resources
For those eager to delve deeper into the world of technical analysis, there are numerous additional resources available:
- Books: Explore a vast array of books dedicated to technical analysis. Works by renowned authors like John J. Murphy, who has written a very detailed book on technical analysis in the financial market, Steve Nison, and Martin J. Pring offer valuable insights. Just in case you want to buy any of their books, John J. Murphy’s book is highly recommended. You can buy it on Amazon by following this link.
- Websites: There are lots and lots of online resources available on the internet; dipprofit.com is one of the many websites where you can get an in-depth understanding of the financial market and learn step-by-step trading.
- Courses: Consider enrolling in online courses or attending workshops conducted by experts in the field. Many educational platforms offer structured programs on technical analysis.
- Trading Platforms: Familiarize yourself with trading platforms that offer robust technical analysis tools. These platforms often provide educational content and tutorials.
- Communities: Join online communities and forums where traders and analysts share insights and experiences. Engaging with like-minded individuals can enhance your knowledge. You can join our telegram community to get access to free trading sessions and free trading classes.
- Newsletters: Subscribe to newsletters from reputable financial news sources that include technical analysis insights and market updates.
Remember that mastery of technical analysis takes time and practice. Regularly analyzing charts, testing strategies, and refining your skills will ultimately make you a more proficient trader or investor. The dynamic nature of financial markets ensures that there is always more to learn and discover.
With the knowledge gained from this comprehensive guide and the resources at your disposal, you are well on your way to using technical analysis as a valuable tool in your financial endeavours. Happy trading! Please kindly drop a like or comment if you found value in the article. See you in the next article.
You can get this article in pdf format, click the button below to download the Price Action pdf format.
«« Download PDF »»
