
Smart Money Concept Trading for Beginners
Introduction
In my previous article, I talked about how to use the SMC trading Strategy in your trading and gave a step-by-step guide to how you can best use the SMC strategy. Months after writing that article, I have gotten several questions regarding the Smart Money Concepts and its effectiveness in both forex and crypto trading.
This has therefore prompted the creation of this article. In this article, I want to simplify smart money concepts in a way that even a little kid can understand. You will notice that most of the information you can find online is about retail trading and basic price action moves like support and resistance strategies. If you search for how smart money and the big banks trade, you won’t find much information about it.
Today, smart money concepts of trading are probably one of the best-kept secrets in the world of trading, which is why many traders are doing all they can to get a deep understanding of this concept. In this article, we will review those secrets together. Once you learn how smart money works, you can easily implement these concepts into your trading style and make even more money.
Firstly I will be shedding more light on some of the basic smart money concepts you need to understand to integrate them into your trading style easily. After this, I will also use examples to illustrate the trading strategy properly. If you are ready, grab your cup of coffee, take your seat, if you are not yet seated and make sure you have your notepad with you. See you at the end of this article.
Now, the Smart Money Concepts Trading Strategy is a simple trading strategy that uses basic trading concepts such as supply and demand, support and resistance techniques, etc, to analyze trade entry and exit positions. Some of the basic terms used in smart money concepts trading strategy include the following:
- Break of Structure (BOS)
- Change of Character (CHOCH)
- Area of Interest
- Liquidity Grabs
- Order Blocks
- Fair Value Gap
Basic Smart Money Concepts Guide
Break of Structure:
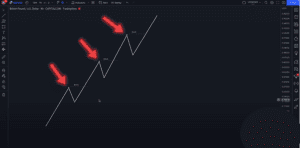
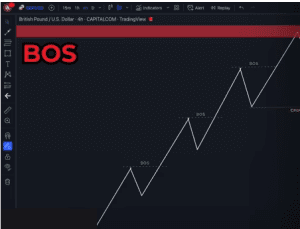
Firstly, let’s talk about BOS or Break of Structure. In an uptrend market, price will look like what is shown in the diagram above. You’ll have your higher highs and higher lows every time price breaks through a new high. This is what we call a bullish break of structure or BOS. So looking at the diagram above, we have a break of structure in the areas marked with a red arrow.
Still looking at the diagram above, after the first break of structure, we can still find other BOS as indicated with the red arrows in the diagram above. This means whenever price breaks the previous high, it forms a new Break of Structure.
As we all know, price cannot continue moving in one direction forever, at some point in time, price will eventually lose momentum and start reversing in the other direction and for this reversal to be valid, price has to break the previous higher low or the last higher low in the case of an uptrend market.
Read Also: Supply and Demand Zones: A Profitable Trading Strategy
Change of Character (CHOCH)
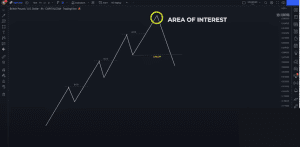
So this is the previous high low, and price has to break below it for it to be valid. Once this move has happened, this is what we call the Change of Character (CHOCH), as indicated in the diagram above.
In order for this Change of character (CHOCH) to be valid to work, we want this previous high to be an area of interest like either a supply or demand zone or an order block. This means the stronger the supply and demand zone, the better it is, right? If you are following me, then you should know the answer already.
To make it clear, the stronger the demand or supply zone is, the more effective the change of character will be. In case you don’t have a deep understanding of supply and demand zones, you can read about them on this website also.
Looking at the diagram above, once we have a change of character, the CHOCH and an area of interest which can be your demand or supply zone, although in the case of the chart above, the supply zone is our area of interest, we can expect price to reverse and start going down, and as it starts to go down, it will create your lower highs and lower lows and lower highs and lower lows.
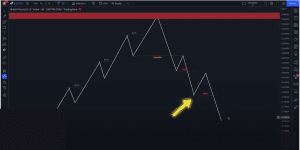
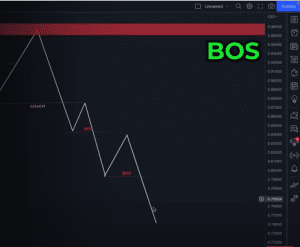
As price creates your lower highs and lower lows, it will also create your bearish break of structure (BOS) whenever price breaks through a lower low. When price breaks through a lower low, it creates another break of structure right here.
Looking at the diagram above, we can see the bullish break of structure.
The diagram above indicates our bearish break of structure.
The diagram above indicates our change of character.
At some point in time, this downtrend will start losing momentum like this uptrend right here, it will start reversing back up and this will create your change of character right as indicated in the above diagram.
This is pretty much the whole concept of using the smart money concepts strategy, the break of structure, and the change of character.
Area of Interest
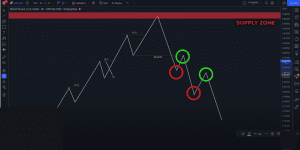
In other for this strategy to work, we want the area of interest, this zone in red, which is also known as the supply and demand zone, to be as strong as possible because the stronger it is, the more likely the price will move in the direction that you want it to. Now, what do I mean by a strong area of interest? These are price levels where the market is likely to make a significant change in direction due to the immense number of orders/liquidity.
There are two methods that you can use in identifying a strong area of interest. The first method is what we call the liquidity grab at a supply or demand zone. Firstly, you need to identify a strong supply or demand zone on a higher time frame, like the 1-hour time frame or above, as mentioned in the previous article I wrote here on SMC trading strategy.
So the higher the time frame, the stronger the area of interest will be, please note this is very important, which is why I have mentioned it in all my articles involving the supply and demand zones, the next thing you should be looking out for is your liquidity grab.
Liquidity Grab
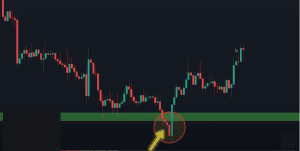
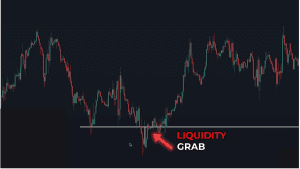
Now you might ask, what is a liquidity grab? Before we go further, let me define that. Liquidity grab is basically a false breakout, right in this case, where Price breaks through a recent high or low, does a fake out like in the diagram above, and then reverses in the opposite direction.
The psychology behind this liquidity grab is that people will be entering a sell position when Price breaks through the recent low because this is the recent low and when price breaks through the recent low, the sellers will be selling down because they think that this is a downtrend. This can be seen in the diagram above also.
Now, when they enter for a sell right here, as shown in the diagram above, they will place their stop loss above the last lower high, which is right here. So if price ends up doing a false breakout and price actually comes up, it will hit all their stop losses, adding fewer to the fire and increasing the momentum, causing Price to shoot up.
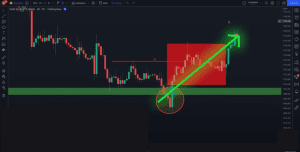
At this point, we can take advantage of this by entering a buy position right after the bullish candlestick as indicated in the diagram above, using the bullish engulfing candlestick pattern as a confirmation. This is because this candlestick pattern tells you that the buyers are largely in charge of the market at the moment. You can read more about candlestick patterns in one of my articles. From the chart above we can see that price continued the upward momentum for quite some time.
Order Blocks
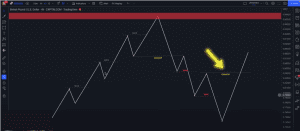
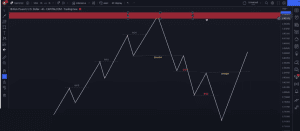
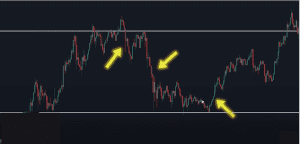
The second method for finding a key area of interest is using order blocks (OB). This is also the most common method used by smart money concept traders. An order block is basically an area where the smart money and big banks like to enter and exit. Now the next step is finding or spotting the order blocks. You can spot order blocks by looking for strong reversals, as illustrated by the three yellow arrows in the diagram below.
From the above diagram you can see that whenever price goes up to the horizontal line, it reverses down strongly and when price comes back down, it reverses back up strongly. The levels indicated in the above diagrams by the white horizontal lines are what we call the order blocks.
Read Also: How to Trade Like a Pro Using SMC Trading Strategy
Smart Money Concepts Trading Strategy
Now we should have properly understood some of the complex but common terms used in smart money concepts trading as I have used some pictorial illustrations to simplify and explain them showing you how they can be identified. Let’s take it a step further by combining what we have learned so far with examples as I show you a high-win-rate smart money trading strategy.
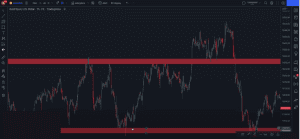
While using this strategy, make sure that you are using a higher time frame, as I have mentioned several times now, like the 1-hour time frame, because the first thing to do before you do any other thing is to mark up your key levels or supply and demand zones by finding where price is reversing or respecting.
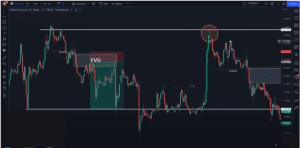
Looking at the diagram above, we can see that at this point, price retested this particular zone about four times making this a very strong supply zone, therefore, I can draw another demand zone at this key support area right here as indicated in the diagram below.
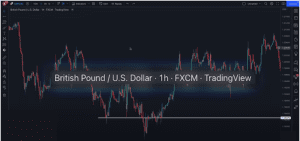
Now I’m going to show you this strategy on GBP USD, the great British pound against the US dollar.
Looking at the diagram above, we can see that there’s a support area right around this area here because whenever Price comes back down here, it always reverses and it does this more than once, confirming the fact that price has been respecting the demand zone, or the support level, depending on what you like to call it.
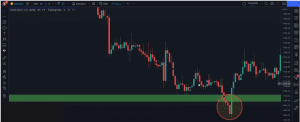
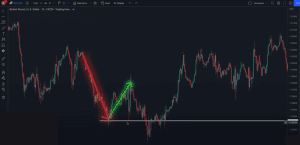
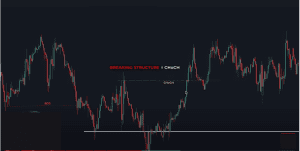
Over here, Price gave us a liquidity grab, so the first thing you want to look for is for Price to give us a liquidity grab or a force breakout at a supply or demand zone, which is precisely what Price gave us in the diagram above. Price broke through the support level/demand zone and then it just went back up. This was an obvious false breakout, or what we like to call a liquidity grab. Now, you can even mark up your break of structure here, and the next thing you want to look for is a change of character.
The Price must make a change of character after the liquidity grab, do not take that trade if there is no change of character, it’s very, very important that you look out for a change of character after the liquidity grab. In the diagram above, we can spot a change of character right there because this is the last lower high before Price collapse. Then at this point in time, this is when Price has broken through the last lower high, initiating a break of structure and triggering a change of character.
After spotting all these key levels while using the smart money concept, the next step is understanding the perfect time to enter a trade. Using the liquidity grab strategy, the best time to enter is when there is a fair value gap.
Fair Value Gap
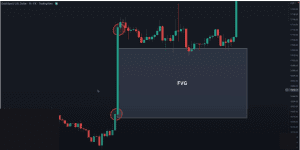
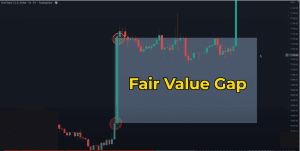
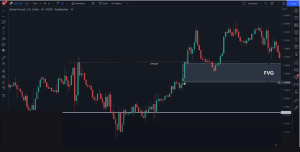
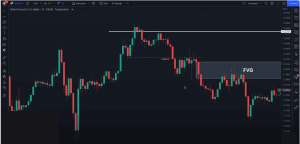
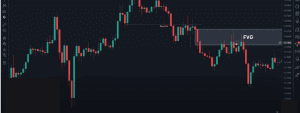
Hold on, don’t get overwhelmed yet, I will quickly explain the meaning of ‘fair value gap’. A fair value gap happens when Price goes up or down so fast that it doesn’t give the buyers or sellers enough time to enter the market, therefore creating an imbalance in the market. You can see a perfect example in the diagram above.
The Price will usually go back up or come back down to this fair value gap and reject it as shown in the diagram above, and that is when you can enter for the trade.
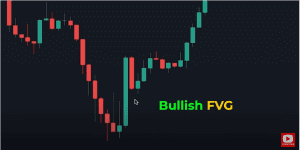
You can mark a fair value gap by using a rectangle tool to mark the previous candlestick before the big move and then take the next candlestick after the big move as shown in the diagram above, this would be your fair value gap.
There is a bullish fair value gap, which is basically a big fat green candle as shown in the diagram above.
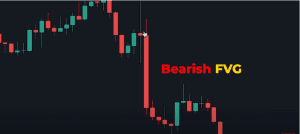
There is also a bearish fair value gap like this big red candle right in the diagram above.
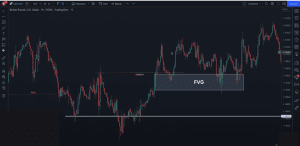
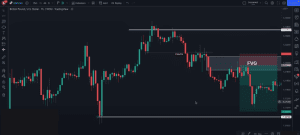
Let’s get back to the example you want to enter for a buy when the price has come back down to our fair value gap. In this example, looking at the diagram above, we can spot a fair value gap right there. You can see right here there’s a fair value gap and right now what we want to do is to wait for price to come back down to retest this fair value gap, then that is when we can enter for a buy.
The reason why I mark this as the fair value gap is that if you look towards right here at this candle indicated in the diagram above, price went up super fast, right, it went up, gave us a big fat green candle, this candlestick wick, the next candlestick wick, and the candlestick wick before it, I marked up the entire box giving us the fair value gap.
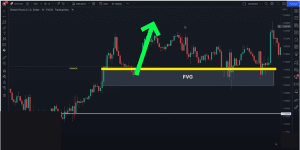
One thing you should also know is that price can come to the middle of the fair value gap, reject it and then continue going up. But at the same time, remember, the price can do anything it wants.
Price can also touch the fair value gap like this area shown in the diagram above, touch it, and reverse and go back up. Now if you were waiting for the price to go to the middle, you have missed out on the trade. Ultimately it’s really up to you which way you want to do it. There is no right or wrong way.
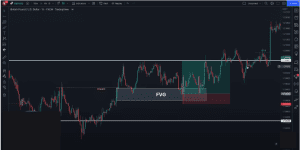
In this trade, we will enter for a buy right here when prices come to the middle of this fair value gap, and it’s showing me some signs that it’s going to reject it and head back up.
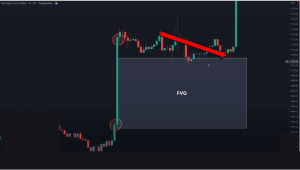
I’ll place my stop loss below the fair value gap as indicated in the diagram above, and I’ll place my take profit at where price last stopped at. If you look towards the left a little resistance area was formed right around that area, that is where we should place our take profit, and as you can see, this was a one to three risk-to-reward ratio trade, which is a very beautiful trade.
Another advantage of trading fair value gaps is that you are able to get those nice sniper entries which will give you a high risk-to-reward ratio.
Looking at the diagram above now, this trade smashes our take profit right here making it a very beautiful trade. Now let’s try to look for another trade opportunity.
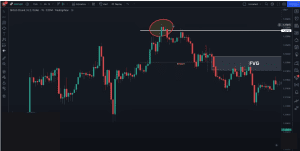
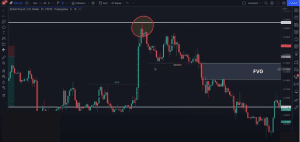
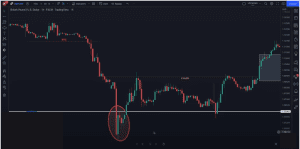
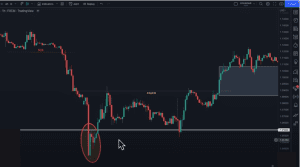
So to show you this strategy works, we will continue using this strategy on this chart. Let’s look for another opportunity you can see at this point in the diagram above price creates another resistance area or rather a supply zone which is represented by the white line in the diagram above and it gave us a liquidity grab in the area with the red circle when price broke through the resistance and then came back down making it a false breakout.
Looking at what I have already talked about in this article, what we saw in the previous chart was a false breakout. We therefore identify the liquidity grab and the next thing we should do is to look for a change of character.
Looking at the chart above, we can see a change of character right there because this is the last higher low before price goes up and failed to break past. So there was a little change of character right here. Price then came back down, and broke through the last higher low, giving us a change of character.
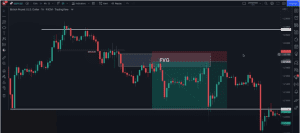
The next thing we need to do to mark up the fair value gap, looking at the diagram above, I can mark up a fair value gap right there because I saw there’s a huge pushdown and there’s a big bear candle here. So I’ll mark the fair value gap right here and you can see prices went back up to retest the fair value gap.
Now this is where I will enter a sell position and prices came back up to retest this fair value gap. In the middle of this fair value gap, place a stop loss above this fair value gap and take profit all the way down at the next key support level.
We can see the support level right here, so I go ahead to place my take profit right there. Looking at the result, this was a very beautiful trade as we ended up smashing our take profit on this trade. It’s really as simple as that.
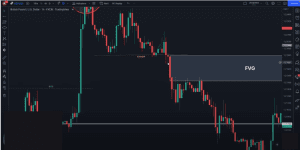
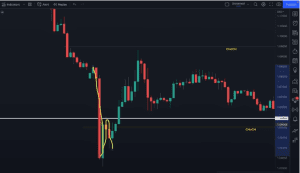
So right here, still using our GBPUSD for illustration, after we close the previous trade, once again, price is at this support area as shown in the diagram above, consolidating around the area, and there’s a break of structure over here when the Price broke through the last high right here. At this point in time, price went back up to the same resistance area that we have drawn, giving us a liquidity grab.
Once again, looking at the diagram above, we have gotten our liquidity grab, which is identified by the red circle and then this is the last lower low or last higher low which is indicated by the thin yellow line in the diagram, now Price has broken this last higher low. As you should already know Once Price has broken this last higher low, it gives us a change of character (CHOCH) which is also represented in the diagram. When Price gives us a change of character the next step is to look for a fair value gap.
Looking at the diagram above, we can see a fair value gap right here, the big red candle there, and you can see that Price went up to retest it, and if you notice, Price did not go to the middle of this fair value gap before going down, it literally just went up, touched a fair value gap and went back down. This is precisely what I talked about earlier in this article. Sometimes Price can touch the fair value gap and then just collapse. In this case, if you are waiting for Price to get to the middle of the fair value gap before moving downwards, you will have missed out on this trade.
If you also missed how we were able to get our fair value gap, I mentioned and explained it in the earlier part of this article, you can go back to read it to get a better understanding.
Read Also: 7 Candlestick Patterns Every Trader Should Know
Now we will look at the last illustration to properly drive home the smart money concepts strategy.
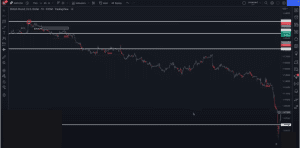
Looking at the diagram above, you will see I’ve drawn some break of structure (BOS), and honestly, you can easily draw Break of structures on price charts, but you should understand that this strategy is more about the change of character.
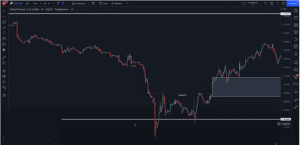
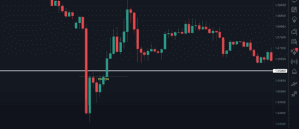
Therefore, looking at the diagram above right now, Price has been collapsing, coming down to our support area or demand zone, which is indicated by the white horizontal line shown in the chart above. Also looking closely at the chart, you will discover that we are using a 4 hours timeframe to spot the supply and demand zones and this is a high timeframe.
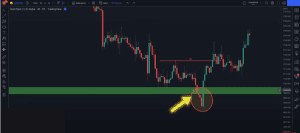
After which, as shown in the above chart, Price then gave us a huge liquidity grab, combined with the false break out.
The next thing we have to look for is a change of character (CHOCH), and we have gotten a change of character right in the diagram above because this is like the last high, and Price has broken the last high right here. So this was a little change of character and, actually, within this booth.
We can actually spot another change of character somewhere right around here, as shown in the above diagram, because if you look closely price was trying to create a new lower high and lower low and lower high and lower low and if you were to do that, so Price actually gave us a last lower high right here. The moment Price breaks through, this last lower high, that would be your change of character.
Looking at the diagram above, the moment Price start breaking through this last lower high, this is the last lower high, and Price breaks through it, it becomes a change of character.
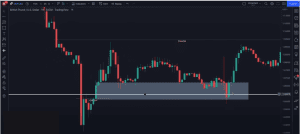
Right now looking at the above chart and using the second CHOCH we discovered, we can spot a fair value gap right as shown in the diagram above, and we wait for Price to come back down to retest this fair value gap, which it did right there also.
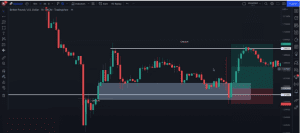
The moment Price start coming down here back to this fair value gap, we are going to be entering for a buy right here, as illustrated in the diagram above. We will then place the stop loss below this fair value gap and place our take profit at the next key level, which is also properly indicated in the chart above.
There’s a key level being formed right in the chart above, also there’s a resistance area, so you can see once again this was a very, very great trade, and I believe you should have understood this process to a considerable extent.
Finally, if you have been able to come this far reading and studying this article, you should be ready to start backtesting the strategy using your demo account first because this is the only way you can fully master the smart money concepts.
Read Also: The Best ICT Trading Strategy Guide For Beginners
Conclusion:
Hello readers, I know that lots of bloggers, trading coaches, and YouTubers have been trying to make smart money concepts very complicated, very, very hard to understand so that you guys can buy their courses. I’m telling you, it isn’t very easy, but it’s also not that complicated and can still be easily understood by everyone as long as you set your heart to it and with proper practice.
It’s still doable, and this is why I have decided to write easy-to-understand articles that will break down the smart money concepts strategy into easier ways of execution because I understand firsthand how it feels as I have once been there as a struggling trader.
When I first started learning about smart money concepts, all these concepts, like BOS, CHOCH, fair value gap, liquidity grab, and OB, looked foreign and complex to me, and I had no idea what those were. I then went ahead to do my research using videos and materials, paid courses, and the rest but I ended up more confused. This was also a driving force for me, as I began to take conscious steps to integrate the smart money concepts strategy in my trading while trying to understand each of the terms and concepts.
After several years of practising and experimenting, I was able to get a more profound knowledge of the smart money concepts and also started linking and relating them with general trading ideologies and terms.
Mastering the smart money concepts strategy Is just all about rinsing and repeating the same thing over and over again till you get very familiar with it. I have also shown you from our examples that this strategy works.
I really hope this article has helped you guys out because I really tried my best to simplify smart money concepts, which is a super complicated concept, into a way that even a five-year-old can understand.
So kindly like, comment, and subscribe for more educating trading articles. If you also want to learn about you can trade using the supply and demand zones strategy, you can check out some of my trading articles by going to the trading education category. Don’t forget to support us by reacting to this article, and remember, you’re just one trade away.
If you have gotten to the end of this article, i am really glad because this means you find this usefull and of value.
I never thought i would say this but, here i am, pleading that you make your positive comments, leave a review and share this article and every other trading article on this platform that you think deserves to be seen.
Google has just taken down a lot of our valuable articles, just because they think we don’t have a voice and our domain authority seems low.
But I know that You, the people, our readers still have the power of choice and with your unanimous reviews, comments, shares and support, we will build a stronger community that will help more people acquire the knowledge and insights we share here without any cost.
Thanks for the review, comment and shares, and most importantly, thanks for taking out time to read this article.
Also Kindly subscribe to our Newsletter here on the Website….
You can also join our Telegram community where you can learn all you want to know about the cryptocurrency space, defi, web3, and airdrop opportunities and also have access to live AMA sessions from time to time, then click the button below to join Dipprofit Telegram Community For Free Now.
You can get this article in PDF format. Click the button below to download the Smart Money Concepts pdf format.
«« Download PDF »»





Thanks so much boss I really enjoyed the article
You are welcome Sir, i am glad you found value here
Does smartmoney participate daily in eur usd in asian session or uk session…any major levels to false breakout identification-1hr chart 4*1hr candle watching enough to find false breakout.is it for intraday smc concept?
Will it work in 15min/30min intraday
Yeah, you can use SMC strategy for EURUSD, especially in Uk session, I talked about the timeframes in my other SMC trading strategy article, you can find the supply & demand zones using higher timeframes like 4h but you can take trades in lower timeframes like 30 mins. Just read up all the articles we have here as regards smc strategy. Thanks for the feedback also.
I just read through ur SMC I liked the way u broke everything down and simified it. Your articles has a great deal of value I really appreciate it. Thank you
Thanks Mr. Harold, glad you found some value, I have also given you a response to your enquiries on your linkedin, kindly respond to it.
A great mentor
Thanks Adam, I hope you found some value Sir?
Hi, does BOS need to close above/below the HH/LL, or wick is fine?
Thanks!
It needs to close above, you can also read my article titled “Trade like a pro with smc trading strategy”, to get a better understanding.
May I ask a question that bothers me for a long time..?
If we have a high(A) like 4500(wick), when a higher wick(B) comes to 4510 but close at 4495, thats not a BOS/CHoch right?
Then we have to wait the candle(C) colses above 4500 or 4510 to comfirm the break? If C’s wick is 4509 but close price is 4505, then is C the HH?
Thanks!
Yeah Buck, you are ON point. If the candlestick closes below the previous one at 4495, then it means it is a fakeout. Meaning no CHOCH yet, the candle has to close above the previous candle and zone with a full body. For it to be confirmed as a CHOCH.
So the CHoCH has to close above 4500 not 4510(the fakeout candle’s higher wick)?
This is GOLD Sir! I’ve trying to learn this from different youtubers and articles but I still find so complicated. However reading your article it’s a different level, truly your goal to make it simple it 100% achieve. Thank you so much Sir! I will continue reading this and apply this knowledge. Keep up the good work and God bless! 🙂
I am glad you found value, you can read more of my articles here on the platform to further broaden your knowledge, at the same time follow dipprofit on twitter to get trading nugget and tips
What a valuable content, highly simplified and to the point.