Bitcoin Cash (BCH), (Xrp) Ripple Price Prediction
(XRP) Ripple Price Prediction
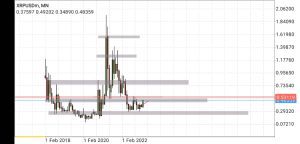
Ripple on the monthly timeframe has been on a downtrend since May 2021 and it’s currently making a pullback to the upside marking a bullish movement to the upside. This month’s candle was bullish as it engulfed the previous month’s candle.
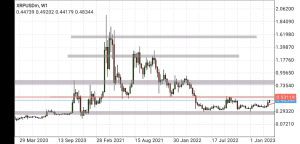
On the weekly timeframe, we zoom out completely to draw our key levels, with our support level will be at $0.26555 price level while our resistance level will be at $0.79409 price level. Zooming in again we can see how the price has been unable to break the support level and has reacted to the level several times before moving to the upside again.
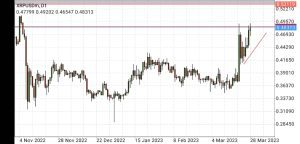
Moving on to the daily timeframe, we can see how price is trying to change its market structure from lower lows to higher highs making the price move from the major support level of the weekly timeframe to the minor resistance level spotted on the daily timeframe, which is at the $0.53916 price level.
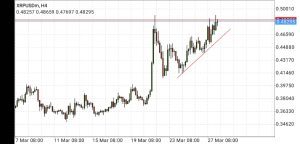
On the four hours (H4) timeframe, we can see that price has started making higher highs movement and is also moving along the trendline with the first point at $0.41379 the second trendline point at $0.41593, and the third trendline point at $0.44131 which is the most recent higher high in the trendline movement.
In conclusion, a break above the previous higher high level will see the price move to the minor resistance. All timeframes are in line with each other giving a bullish sentiment. therefore, our take on this is that Ripple (XRP), is likely to be bullish.
See Also: Bitcoin, Bnb, Ethereum Price Prediction for Week 13
Bitcoin Cash (BCH) Price Prediction
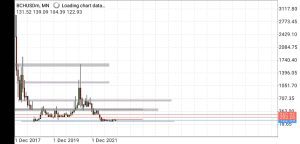
BCH / USDT on the monthly timeframe has also been on a downtrend for a while now, as it has been making lower lows and lower highs movement in line with the principles of market structure. For a while now, price has been ranging at the previous lower low price level.
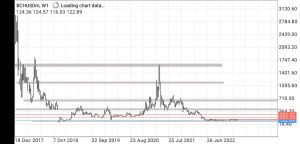
On the weekly timeframe, zooming out completely to draw our key levels, we can draw our support level at $92.80 price level and the resistance at $410.51 price level. Zooming back in, we can see how price have been making lower lows and lower highs in a downtrend movement but is currently ranging at the support level, making it very difficult for price to break through this level.
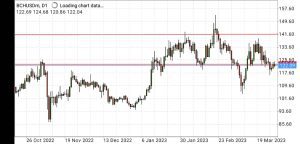
Moving over to the daily timeframe, we can still see BCH price has been ranging at the support level, looking closely we can see a minor resistance at $143.11, at $203.26, and the third resistance level at the $269.95 price level. We can see that both the weekly and daily timeframes are moving in line with each other, and that price has respected the minor resistance and is making its way to the major support level.
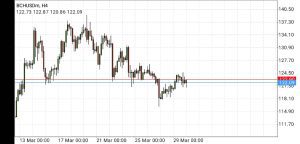
Looking at the 4 hours timeframe we can how price has been making its lower lows and lower highs movement, while making its way to the major support level, taking out liquidity as we expect price to retest the support which serves as a major demand zone and we then expect price to reverse from the demand zone to the next resistance level with massive momentum.
