Ethereum, Bnb, Bitcoin Price Prediction For Week 12.
Bitcoin Price Prediction for Week 12.
The past few weeks have been a roller coaster ride for the crypto space with Bitcoin being at the center of the whole fiesta, the collapse of the Silvergate crypto bank saw a sharp decline in the price of crypto assets, especially bitcoin. But a bounce back came just a few days after, as the Silicon Valley Bank (SVB) with other banking giants faced a crisis that led to users losing their trust in the traditional banking system and opting in for Bitcoin as their safe haven.
Read Also: Crypto Crisis: Bitcoin Falls Amid Silvergate Bank Troubles.
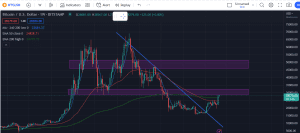
This saw bitcoin bounce back from about $20k price level to as high as $28k dollars in a week, about 30%, the highest Bitcoin has seen in months. Bitcoin is currently at a resistance level as we can see on the weekly chart, Although the price action is presently moving above all the moving averages, a strong sell order block seems to be $28,650 to $30,000 price level.
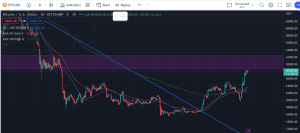
Looking at the daily timeframe, we can see the resistance level is more pronounced as price movement seems to be sideways for some days now, as the bulls are finding it difficult to rally and break through the resistance, while the bears are trying to drive the price down.
Therefore from the chart, we can speculate that a likely pullback is going to happen, where Bitcoin price would drop to the $24,000 to $25,000 level, gather some liquidity from the bulls and use it to break through the resistance zone in the market.
In a situation where the price drops beyond this level breaking through the moving averages that have been also acting as a support, we might see Bitcoin price go to as low as $20,800. On the flip side, if the price breakthrough the resistance zone, we would see Bitcoin get as high as between $37,500 to $39,000.
BNB Price Prediction for week 12.
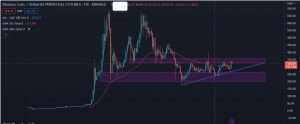
In the weekly timeframe, BNB is currently trading in the supply zone which means we might be seeing a pullback in the price for BNB, although BNB price movement is in an upward trend. Furthermore, the price is above the 100 SMA and the 50 EMA, which is also an indication that the general market trend is bullish even though we are likely to see a pullback as said earlier.
Coming down to the daily time frame, we can see that market sentiment is still bullish, as BNB is trading at $325 with the price action above the 200 EMA, 100 SMA, and 50 EMA. Price is likely to dip to as low as between $306 to $310 before bouncing back up to break the current resistance level it is facing at the $360 – $365 price level.
In conclusion, if the cryptocurrency market bias is bullish, Bnb would see a bullish price movement riding with the trend. Although that might be the case, BNB price might still find it difficult to break through the supply zone resistance level which is at the $360 to $365 price level. A breakout from the supply zone would see Bnb price get to as high as $385.
On the reverse side, if there is no bullish momentum in the cryptocurrency market, and BNB price is still unable to break through the Supply zone level holding at $360 to $365, there is likely to be selling pressure with the bears coming in strong and pushing the price as low as $297 to $295, a further sell pressure can see BNB price tumble further to the diagonal support zone holding at $266 to $260 price level.
One thing of note is that it would be incredibly difficult technically for Bnb price to get to as low as $214, as there is a major demand zone before the $214 price level. Therefore Buying BNB to HODL is not a bad idea. For those who want to do futures and spot trading, just examine the price levels I noted in the chart, and do a bit more examination before you take your BNB trades.
Ethereum Price Prediction For Week 12.
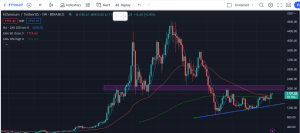
Ethereum price has rallied up about 33% in the past 2 weeks as it follows its other comrade Bitcoin, the creators of the smart contract are currently trading below another resistance zone at the $1867 price level. After riding the bullish wave for 2 weeks, Ethereum price can be said to be consolidating and the current price level, looking at the weekly chart, Ethereum price is trading above all the 100 SMA, 200 EMA, and 50 EMA, which means the moving average is serving as a support level for the price.
Ethereum on the weekly timeframe is in an upward trend as you can see from the chart, and the resistance its facing is very likely going to be broken, as the resistance level might be solid but it is not a supply zone. Therefore, we might see a slight pullback if the weekly candle is unable to break the resistance, this means if Ethereum price is unable to break the resistance at $1867, we might see the price drop to the support level on the weekly timeframe at $1667 price level. After which price would likely gather some liquidity to gain momentum and push to break through the resistance.
On the daily timeframe, looking at the chart, we can see that Ethereum is still having a bullish sentiment as the price is likely to reach the $1915 price level, before hitting the resistance level, if the price fails to break through the current price level at $1835 to $1840, then a sell is likely, as the price would fall to the $1695 price level.
In conclusion, from my view, the market is still having a bullish sentiment, therefore, the current resistance level might push the price down to the previous resistance turned support level at $1695, after which we should see a bullish rally that would take ETH price to the $1915 level, a bullish market is our take on Ethereum.
At Dipprofit, we are dedicated to giving you all the necessary information needed to easily navigate the cryptocurrency, forex, web3, metaverse, and NFT space. Also please note that this analysis is not any form of financial advice as its strictly the opinion of the author, therefore dipprofit would not be held liable for any of your trade decisions.


